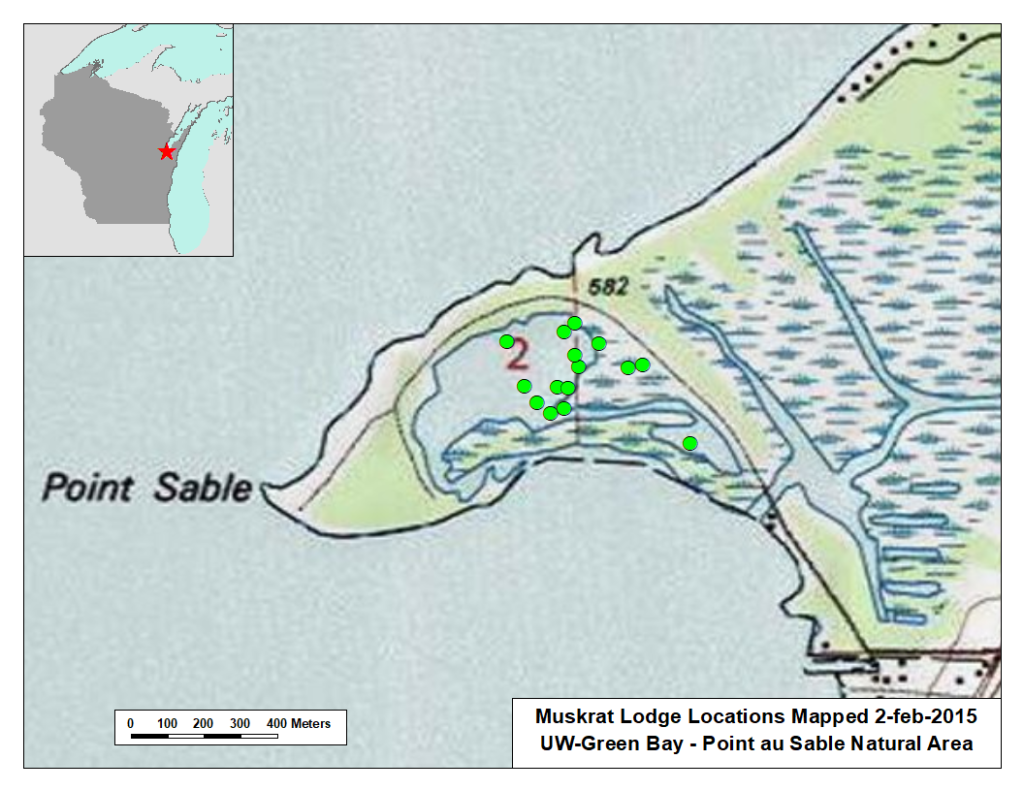
A skillfully-drawn map is a thing of beauty. It functions both as a technical report and as a work of art. But static maps have a huge drawback. THEY’RE STATIC !!
Take the map shown above. It does an okay job of reporting the results of muskrat lodge mapping work done in 2015. But if we want to display our information against a different background or at a different scale, we have to make another static map for each variation.
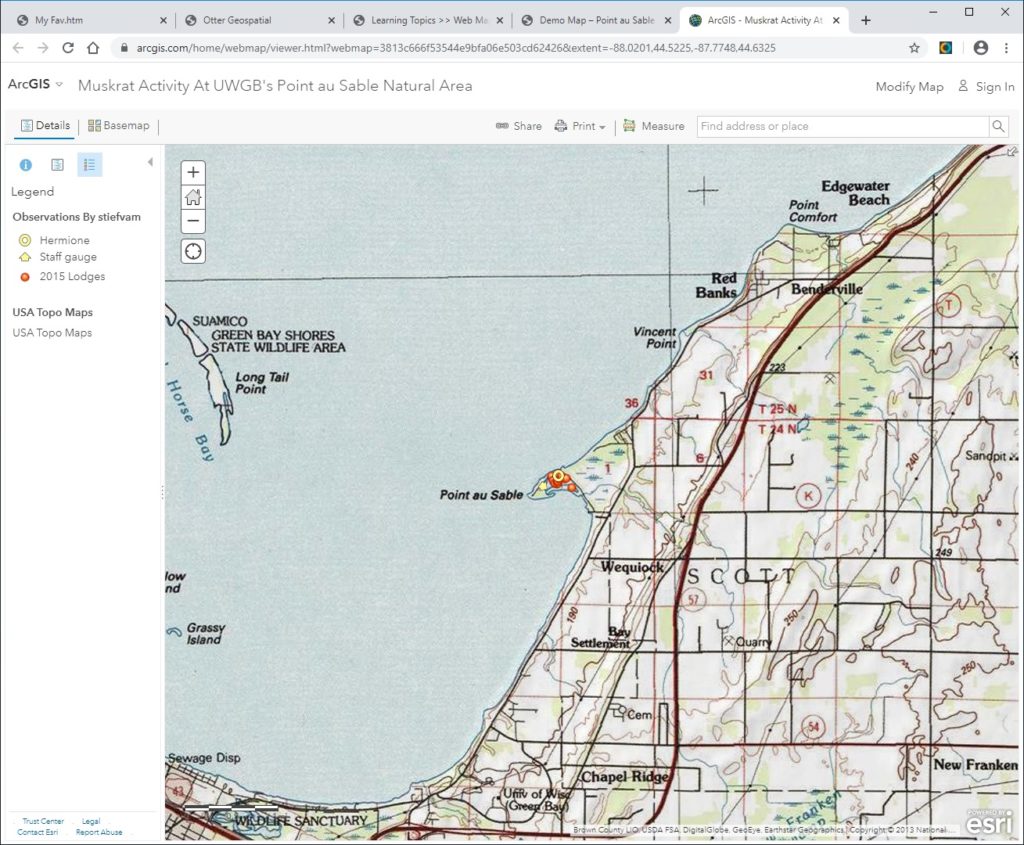
It doesn’t have to be this way. Readily available tools allow us to create interactive maps that do the work of dozens of static maps. We’ve created a simple web map using the same data as was used in the muskrat lodge static map. Click on the thumbnail to open the interactive version of the map and try the actions listed below.
- Zoom out to display data at local, regional and continental scales.
- Zoom in to see the data in greater detail
- Change the background to highlight important aspects of the source data
- Use popup windows to display the attributes of individual items
- Modify and/or add to the map’s source data
- Display the source data as a table
- Link documents to specific locations on the map (photopoints)
- Add data layers to the map by connecting to streaming map services
Comments are closed.